

Massachusetts: OEP plan selections up 3.7% y/y...actual effectuated enrollment flat & dropping...
Sat, 04/18/2026 - 4:30pm
The Massachusetts Health Connector is one of the handful of states operating their own ACA exchanges which publishes effectuated enrollment data on a monthly (actually weekly) basis, so let's take a look...
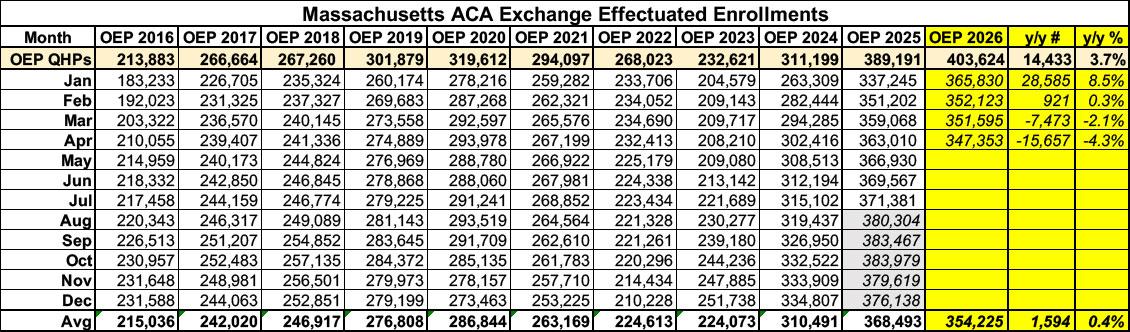
Officially, Massachusetts is one of the ten states in which Qualified Health Plan (QHP) selections during Open Enrollment actually increased year over year (by 3.7%).
However, as I expected and have warned about repeatedly, the year over year change in effectuated enrollment is a different story: While effectuated enrollment in January was actually 8.5% higher than January 2025, it has since dropped off rapidly and April 2026 enrollment is actually 4.3% lower than it was a year earlier...that's a swing of 14,000 more plan selections to over 15,000 fewer people actually enrolled.
Overall, average monthly effectuated enrollment is still up slightly for the first four months, but only by around 1,600 people.
What might this look like for the rest of the year?
Well, here's a visual version of the graph above, with the dotted lines respresenting what the rest of 2026 will look like if the effectuation pattern for the balance of the year follows either last year (2025) or the last pre-COVID year (2019):
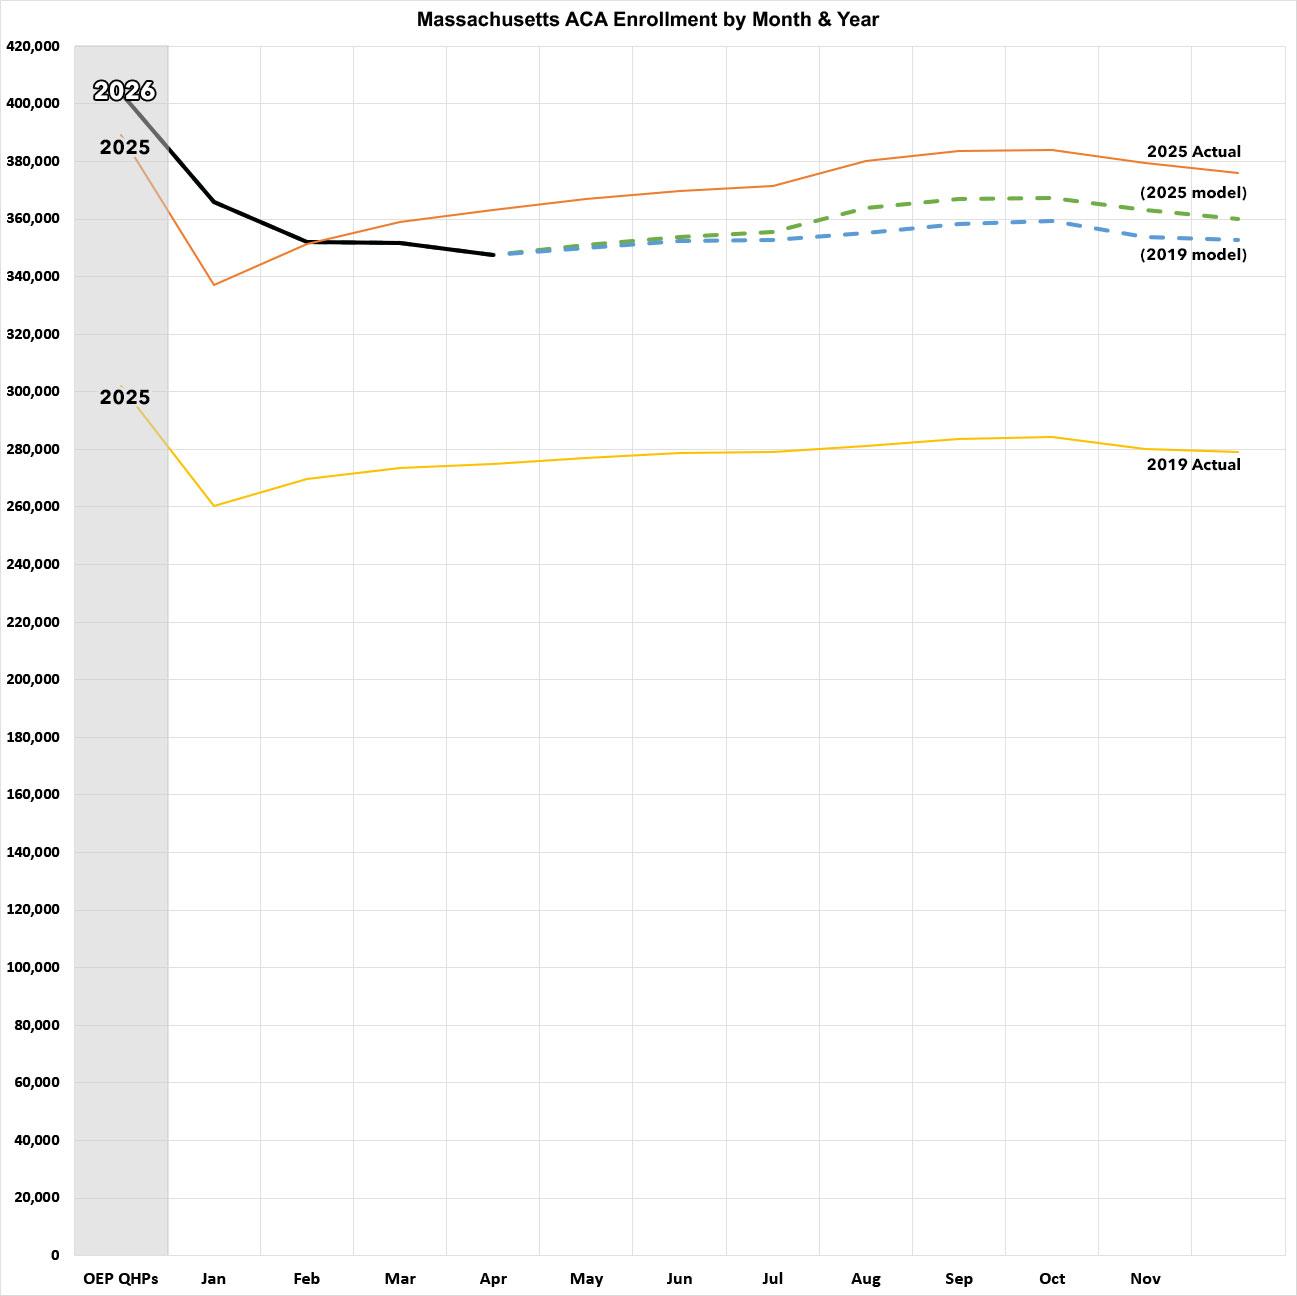
- If the rest of the year follows the 2025 pattern, effectuations will end December at around 360,000 and will average around 358,000 for the year...down 2.8% compared to 2025.
- If the rest of the year follows the 2019 pattern, effectuations will be at around 353,000 by December, and the average for the year will be around 354,000...down 3.8% y/y.
The main reason the 2026 enrollment drop in Massachusetts is likely to be pretty small compared to most states is that not only are they one of the dozen or so states which have implemented state-based subsidies or other specific policy measures to help mitigate the damage caused by the enhanced federal tax credits expiring back in December, but in Massachusett's case, their "ConnectorCare" program covers enrollees earning up to 400% of the Federal Poverty Level (FPL)...which basically means the only enrollees who lost significant amounts of financial help are those who lost all financial help (ie, enrollees earning more than 400% FPL).
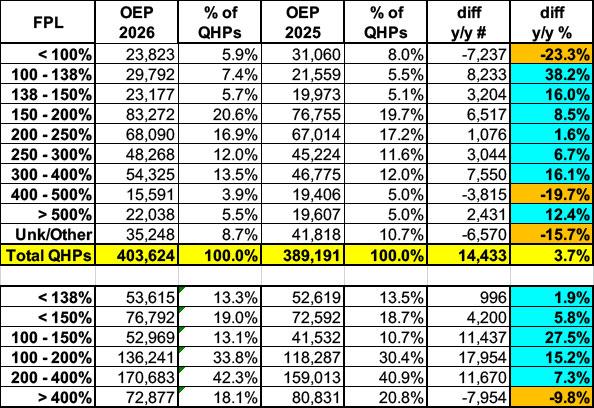
This shows up pretty clearly when you break out year over year enrollment by income bracket: The only income ranges where it drops is below 100% FPL (due to recent low-income documented immigrants no longer being eligible for any federal financial assistance) and over 400% FPL (although enrollment actually increases over 500% FPL, oddly enough).
Overall enrollment increased 7.3% below the 400% threshold but dropped by 9.8% over that line:
Advertisement
