

How much more are ~440,000 ILLINOIS ACA enrollees *really* paying this year due to Trump/GOP policies?
Tue, 06/02/2026 - 6:48pm
IMPORTANT: See the original post in this series for an explanation of the methodology.
Regular readers know that I've been obsessing over the massive increases in both gross as well as net premiums for ACA health insurance policy enrollees being caused by the combination of Congressional Republicans allowing the enhanced federal tax credits to expire as well as other Trump Regime policy changes for well over a year and a half now.
I've written countless analyses of how much both gross and net premiums skyrocketed from 2025 to 2026 across different states, different income levels and various other demographics...and last week it was revealed that over 3 million ACA exchange enrollees had already been priced out of the market as of April, with the number almost certain to climb further throughout the rest of 2026.
As I've repeatedly warned, however, the increases in premium costs (whether gross or net) are only half the story. The other big shoe which is dropping this year is increased out of pocket costs as millions of the ~19.2 million or so remaining enrollees as of April have been forced to downgrade their coverage to avoid (or at least minimize) those massive premium spikes.
In most cases this means moving to plans with higher deductibles, higher co-pays & higher coinsurance costs. In many cases this has also included moving to plasn with worse networks, referral requirements to see specialists and so on.
With that in mind, that's exactly what I've decided to set out to do: Calculate the average year over year increase not just in net premiums (that is, how much more ACA enrollees are having to pay each month) but also the year over year change in average out of pocket costs.
Let's look at ILLINOIS:
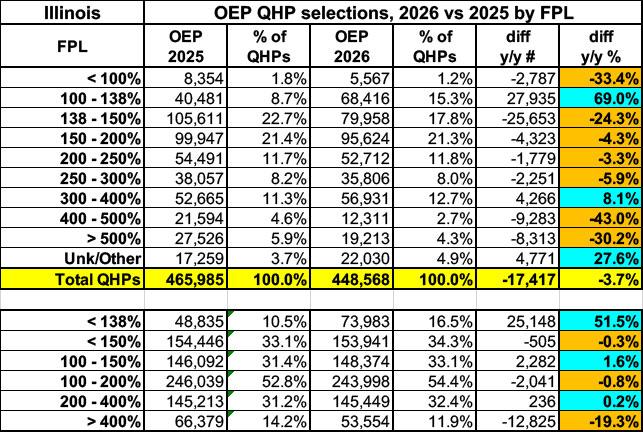
Here's a look at Illinois ACA exchange plan selections during Open Enrollment by household income level this year vs. last.
As expected, enrollment below the federal poverty level (FPL) has dropped by a third, due mostly to the Trump Regime eliminating federal subsidy eligibility to low income legally-residing immigrants who have been U.S. residents for less than 5 years, along with some other categories of documented immigrants. Enrollment just over 100% FPL has actually increased quite a bit; this is likely partly due to U.S. citizens who normally have incomes slightly under that threshold doing whatever they can to nudge their household income over 100% in order to qualify for the subsidies which remain.
Enrollment at most other income bracket has also dropped, especially (by 43%) over the 400% FPL threshold since that population is no longer eligible for any financial assistance either...as well as, depressingly, in the 138 - 150% FPL range, where enrollment dropped by 24%.
Plan selections increased slightly in the 300 - 400% FPL range, however, likely due to a bunch of people who normally earn slightly more than 400% FPL projecting incomes just below the cut-off point in hopes of remaining eligible for subsidies by cutting hours, maxing out their IRA/HSA accounts and so forth. Of course, if they end up coming in even $1 over 400% FPL, they're screwed when they file their taxes next spring, so this is a dangerous game to play.
OK, onto the main analysis: Here's total Open Enrollment plan selections for both 2025 & 2026 broken out by raw metal level:
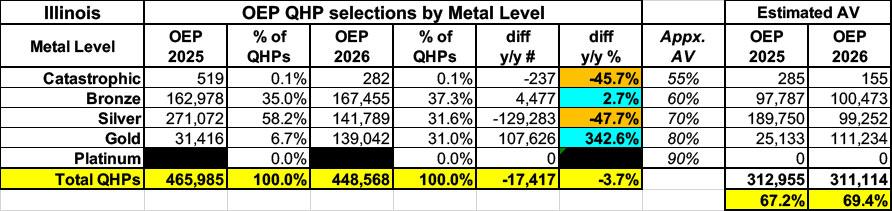
On the surface, besides Illinois seeing ~17,000 fewer people sign up for coverage out of the gate, this makes it look like the average Actuarial Value (AV) increase slightly, from 67.2% to 69.4%.The most remarkable number is that massive 343% spike in GOLD plan enrollment, which is due to the state newly implementing Premium Alignment pricing this year.
However, this is somewhat misleading since a huge chunk of ACA enrollees are generally low-income enough to be eligible for Cost Sharing Reduction (CSR) assistance, which boosts Silver plans up to Platinum levels of AV for most CSR enrollees. When I adjust for that, the weighted average AV increases in both years...but it has actually dropped by about 2 points since last year.
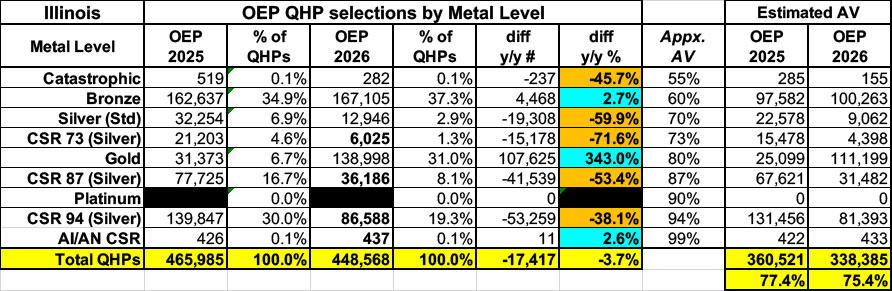
NOTE: While the CSR category breakout is estimated for most state-based ACA exchanges, in the case of Illinois, I was able to acquire the hard numbers for all four categories (73, 87, 94 & AI/AN) from a contact there.
By combining these numbers with the average gross premiums per enrollee I'm able to calculate an estimate of the average total medical expenses each enrollee racks up each year assuming an 80% average Medical Loss Ratio (as I stated in the original post, this can vary widely by carrier and year, so should be considered a very broad average only), which looks like so:
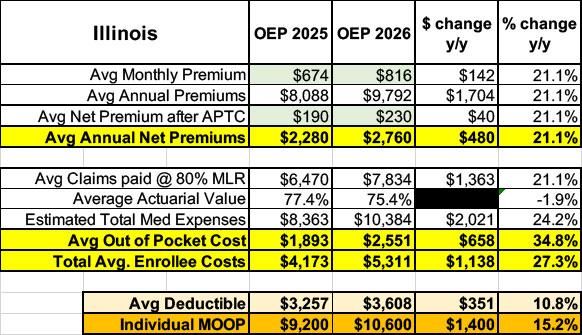
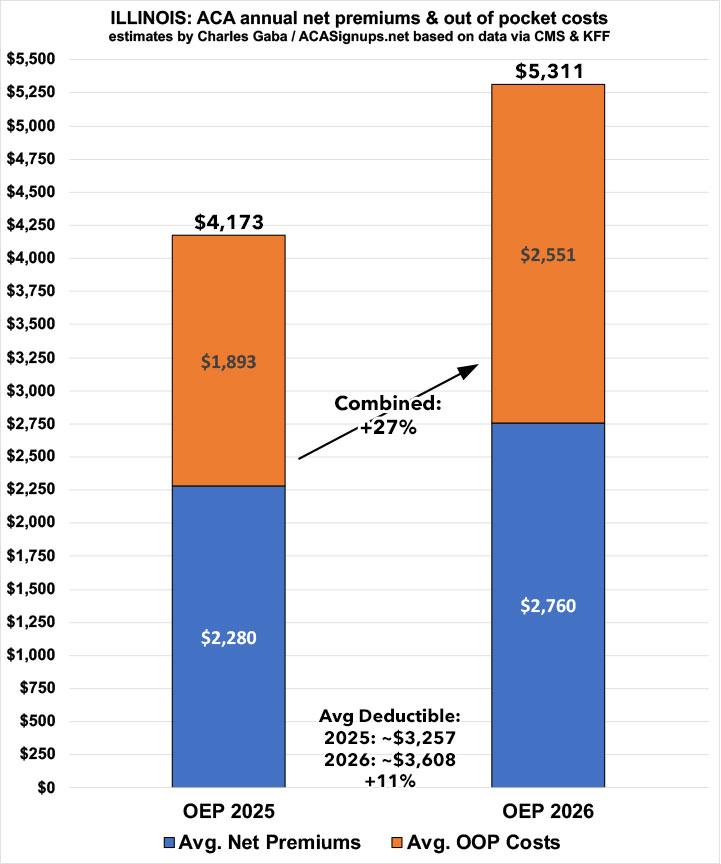
In Illinois, the ~448,000 enrollees who still had ACA coverage as of a month or so ago have seen their net premiums jump by 21% on average...which is actually modest this year.
In addition, their average out of pocket expenses have gone up by around 35%, for a combined average healthcare cost increase of 27%.
That's an increase from ~$4,200 to ~$5,300 per enrollee this year...over $1,100 more apiece.
In addition, based on KFF's net data, average deductibles also jumped by ~11% to around $3,600 for single coverage this year, and the maximum (theoretical) out of pocket cut-off for all ACA enrollees went up by over 15% this years as well, to $10,600 for single coverage.
Next up: INDIANA.
Advertisement
